


Logarithmic charts are a powerful tool for presenting complex data in a digestible format. As an essential instrument of technical analysis in various sectors, they have gained popularity due to their ability to depict percentage changes rather than absolute ones effectively. This unique feature enhances data interpretation, facilitating better decision-making processes—the key to successful strategies in competitive markets. Let’s take a closer look at the dynamics of logarithmic charts in this comprehensive guide.
Understanding Logarithmic Charts

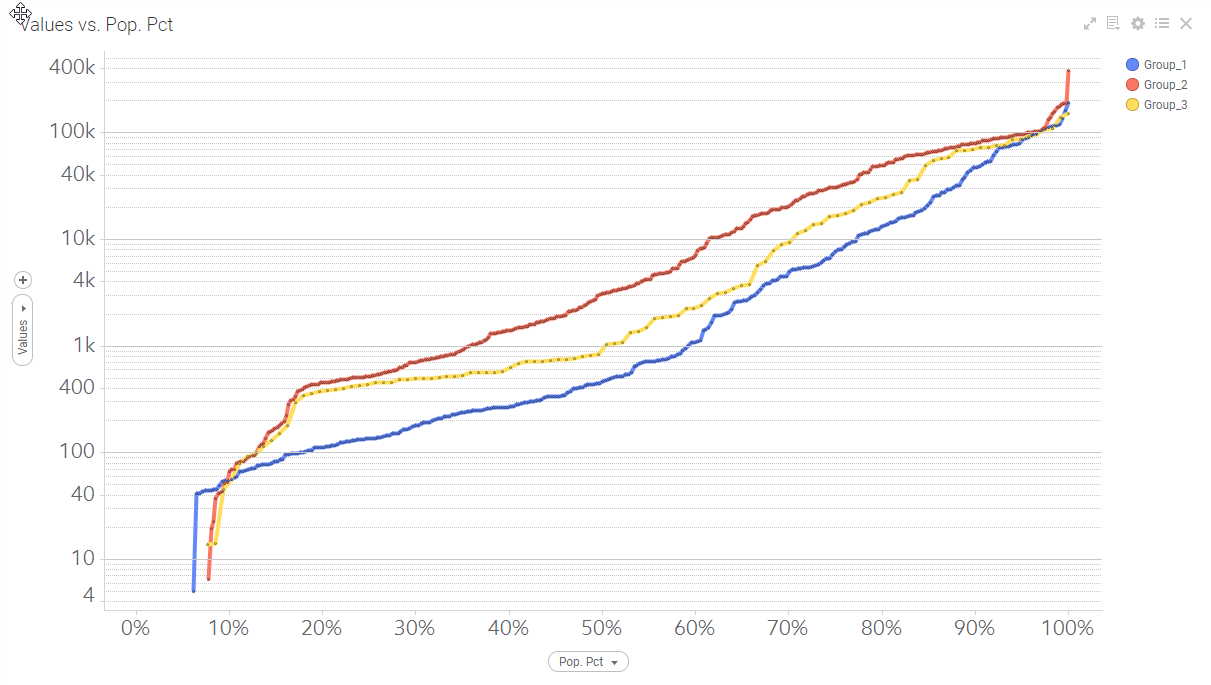
A logarithmic chart, commonly known as a log chart, is a type of data visualization tool that portrays data values using logarithms. It is particularly useful when data spans a large numerical range or when relative rather than absolute changes are the focus. Log charts can graphically represent complex data sets, rendering them more understandable.
Log charts convert absolute data changes into percentages, which emphasize the comparative effect of changes more than the sheer scale of change. So, for example, a rise from 1 to 2 is treated the same as a rise from 100 to 200, as both reflect a 100% increase.
The unique trait of log charts to depict relative changes makes them preferred in cases where data varies exponentially. These charts help interpret patterns and trends in data that might otherwise be hard to notice.
Full apprehension of the logarithmic chart goes hand in hand with understanding its basic equations and processes. The logarithm is the reverse operation to exponentiation; hence, understanding logarithms is simply about understanding powers. The chart’s backbone is the powerful mathematical tool— logarithm, which assists in multivariate analysis.
Significance of Logarithmic Charts in Data Visualization
Log charts play a pivotal role in data visualization. With their ability to accurately display data that spans several orders of magnitude, they bring compelling advantages to data analysis.
They are instrumental in exhibiting relative changes, capturing the essence of data transformation over time. This gives a more profound insight into potentially hidden data patterns and trends that are paramount for strategically significant decisions.
Moreover, log charts are particularly effective in comparing growth rates. Unlike linear charts that depict absolute growth, logarithmic charts emphasize the rate of growth, which is crucial when comparing businesses of different sizes, countries with varied economies, or stocks with diverse scales.
In finance, they are used to visualize stock price movements over long periods. Scientists and researchers use logarithmic charts to represent data that spans several orders of magnitude like light intensity, sound intensity, pH value measurements, and so forth.
Geologists use logarithmic plots for the representation of data with large dynamic ranges, such as seismic wave amplitude, soil components, acoustic signals, and more. Economic data depicting variables such as GDP, inflation rate, and stock market indices, which tend to grow exponentially over time, often need the clarity of a logarithmic chart to capture growth rates and trends effectively.
By leveraging the relative and growth-oriented perspective provided by log charts, organizations can make well-informed, timely, and strategic decisions, thereby optimizing their performance and competitiveness.
Fundamentals of Reading a Logarithmic Chart


Understanding how to read a log chart may initially seem challenging, but with some fundamental knowledge, it becomes relatively manageable. The key to reading a log chart lies in understanding that it depicts percentage changes instead of absolute ones. In other words, equal distances on the chart represent equal rates of change, not equal values.
Another essential aspect is the comprehension of the “logarithmic scale.” While the numeric values are not equal, their ratio is. For instance, the gap between 10 and 100 would be the same as that between 100 and 1,000, as each represents a tenfold increase.
To facilitate understanding, most log charts are labeled with their associated values, allowing readers to comprehend the portrayed variations directly. Proportional increased or decreased data points are exhibited with equal space on a log chart, which is contrary to a linear chart representation.
Having grasped the fundamentals of reading a log chart, an individual can analyze complex data effortlessly, making it easy to discern key trends and patterns vital for efficient strategic planning.
Overall, the importance of understanding and using logarithmic charts effectively cannot be overstated. With their unique ability to showcase percentage changes, they add depth to data analysis that can be pivotal for decision-making in various sectors, from finance to health to scientific research.


